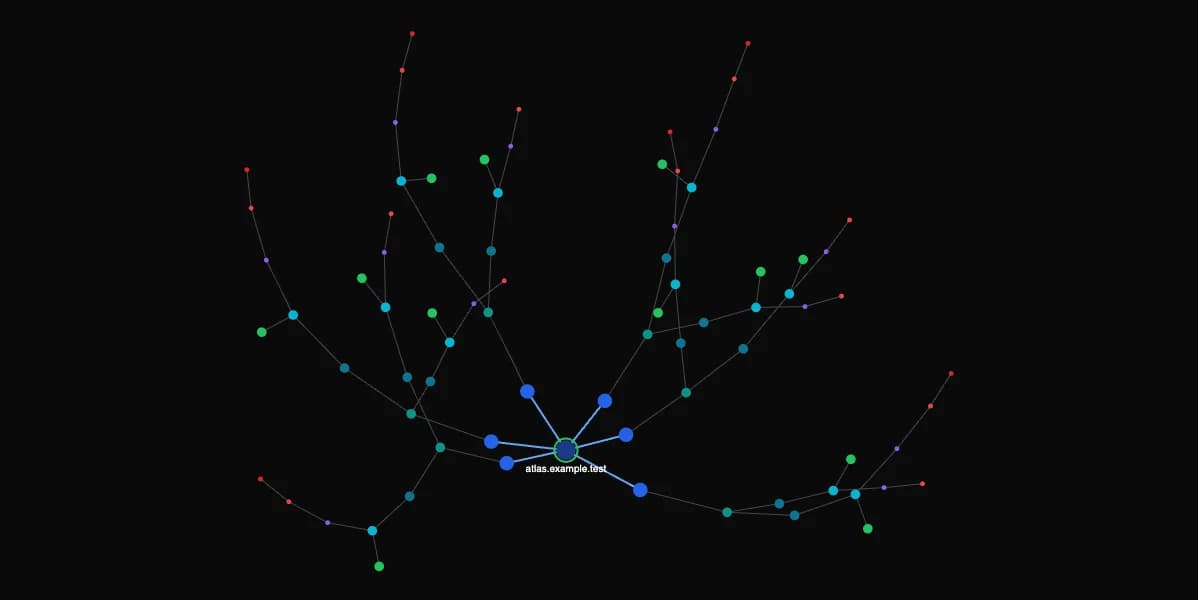
Explore the relationships. The RedAmon 3D graph experience, populated entirely with synthetic examples. Follow an asset to its services, components and observations. Nothing here represents a customer assessment.
Open your workspace
Synthetic RedAmon graph · the 3D graph renderer uses invented nodes and relationships. No customer data, live scan or validated result. Inspect a synthetic node atlas.example.test · Domain api.atlas.example.test · Subdomain 198.51.100.11 · IP 443/tcp · demo 1 · Port Demo TLS service 1.1 · Service /demo/route-1-1 · Endpoint Demo component 1.1 · Technology Demo observation 1.1 · Vulnerability Demo reference 01 · CVE 8443/tcp · demo 1 · Port Demo TLS service 1.2 · Service /demo/route-1-2 · Endpoint Demo component 1.2 · Technology Demo observation 1.2 · Vulnerability portal.atlas.example.test · Subdomain 198.51.100.12 · IP 443/tcp · demo 2 · Port Demo TLS service 2.1 · Service /demo/route-2-1 · Endpoint Demo component 2.1 · Technology Demo observation 2.1 · Vulnerability Demo reference 02 · CVE 8443/tcp · demo 2 · Port Demo TLS service 2.2 · Service /demo/route-2-2 · Endpoint Demo component 2.2 · Technology Demo observation 2.2 · Vulnerability auth.atlas.example.test · Subdomain 198.51.100.13 · IP 443/tcp · demo 3 · Port Demo TLS service 3.1 · Service /demo/route-3-1 · Endpoint Demo component 3.1 · Technology Demo observation 3.1 · Vulnerability Demo reference 03 · CVE 8443/tcp · demo 3 · Port Demo TLS service 3.2 · Service /demo/route-3-2 · Endpoint Demo component 3.2 · Technology Demo observation 3.2 · Vulnerability docs.atlas.example.test · Subdomain 198.51.100.14 · IP 443/tcp · demo 4 · Port Demo TLS service 4.1 · Service /demo/route-4-1 · Endpoint Demo component 4.1 · Technology Demo observation 4.1 · Vulnerability Demo reference 04 · CVE 8443/tcp · demo 4 · Port Demo TLS service 4.2 · Service /demo/route-4-2 · Endpoint Demo component 4.2 · Technology Demo observation 4.2 · Vulnerability assets.atlas.example.test · Subdomain 198.51.100.15 · IP 443/tcp · demo 5 · Port Demo TLS service 5.1 · Service /demo/route-5-1 · Endpoint Demo component 5.1 · Technology Demo observation 5.1 · Vulnerability Demo reference 05 · CVE 8443/tcp · demo 5 · Port Demo TLS service 5.2 · Service /demo/route-5-2 · Endpoint Demo component 5.2 · Technology Demo observation 5.2 · Vulnerability ops.atlas.example.test · Subdomain 198.51.100.16 · IP 443/tcp · demo 6 · Port Demo TLS service 6.1 · Service /demo/route-6-1 · Endpoint Demo component 6.1 · Technology Demo observation 6.1 · Vulnerability Demo reference 06 · CVE 8443/tcp · demo 6 · Port Demo TLS service 6.2 · Service /demo/route-6-2 · Endpoint Demo component 6.2 · Technology Demo observation 6.2 · Vulnerability
atlas.example.test · Domain This node is invented. Its category shows how RedAmon represents related assets and observations.
has subdomain api.atlas.example.test has subdomain portal.atlas.example.test has subdomain auth.atlas.example.test has subdomain docs.atlas.example.test has subdomain assets.atlas.example.test has subdomain ops.atlas.example.test Renderer adapted from RedAmon (MIT). Licence · Download synthetic dataset . Drag to orbit; right-drag or use two fingers to pan. Use the view controls to zoom. No automatic rotation.